Click Here for Printable Version
The market’s patience with Donald Trump and his “Phase One” China trade deal was finally rewarded with a verbal agreement.
This was just in time for the traditional Santa Claus rally which helped global equity markets to deliver well above average returns in 2019. But this was against a background of weak and in many areas declining corporate profits, declining economic statistics and US Treasury Bonds indicating that a recession might be close.
The markets believed that this corporate weakness was all down to the China trade war and with it now in abeyance (hopefully) the assumption is that profit growth will accelerate from here.
This time last year, the US Federal Reserve Bank had pushed up interest rates on the basis that the US economy had returned to normal but that was before Trump’s trade war.
In response they cut and due to immense stresses in the US Repo market have restarted QE via the “back door”.
So, for the markets we ended the year with good news, but with still one very big negative, no profits growth.
For 2020 the markets are forecasting that growth will return, especially as the Presidential Election process gets underway.
For the Fed though, they will have a problem, traditionally they do not move interest rates during an election year and they may have just moved rates down too far, too soon.
Furthermore, their attention will be focused on the Repo market, it is here that any trouble may be seen first.
2019 Investment % Returns
(Source: Financial Express)
Returns for 2019 have been very healthy, but we have to bear in mind that this was a recovery year from the negative figures of last year.
What really matters is the valuation, remember as investors, not speculators, we don’t buy prices, we buy value.
After the last US corporate earnings season the combined profits of USA Inc. was $39.81 per share, a fall of 3.8% over the year, not good.
This has pushed the market’s valuation up from 19.4 Price/Earnings ratio up to 21.1, expensive, but okay by historic norms.
We also have to factor in the record low interest rates and lack of inflation.
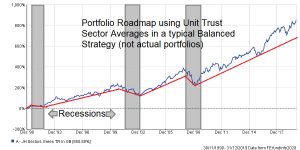
Portfolio Roadmap
This roadmap uses Unit Trust sector averages weighted in-line with a balanced portfolio strategy over the past 30 years (a typical retirement period).
The key takeaway is that recessions will hit portfolio values for a short period (12 to 18 months) and by historic standards we are overdue one.
There are two types of recession, deliberate ones caused by Central Banks rapidly increasing interest rates to choke off inflation and secondly, by a banking crisis causing a liquidity shortage, which at its most extreme becomes a Credit Crunch, just like 2008/09. From the economic stats it would appear that, for now, the former is a low probability event.
However, it is possible that the Fed cutting rates in 2019 has poured gasoline onto a smouldering fire and the US economy could accelerate from here into the election.
If so, inflation might become a problem and the Fed will have to act in 2021 after the next President takes office, especially as, traditionally their hands will be tied this year.
A banking crisis is always a possibility, these are dangerous as they can come out of nowhere. The problems in the Repo market are perhaps the very first hint that trouble might be brewing somewhere? Hong Kong remains a significant risk if China invades; European banking remains a complete mess and cyberattacks might well be a catalyst for the occasional “flash crash”.
These are all possible risks but not as yet probable risks, what we can say is that as the cycle gets even more mature it is prudent that clients maintain their advised cash reserves.
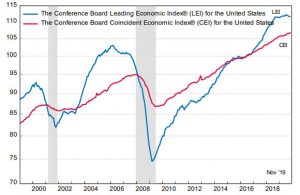
Conference Board Leading Indicators
(Source: The Conference Board)
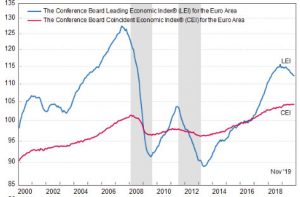
The US Conference Board provides us with a series of Leading Indicators which as the name implies gives us a reasonably accurate predictor of a recession.
The above left hand chart is for the USA and when the Leading Indicator (blue line) rolls over it suggests that around 12 months later the US could enter a recession (shaded areas).
Somewhat worryingly the line looks as if it might just be rolling over.
That would coincide with the usual post Presidential inauguration recession. We need it to start moving back up and soon.
The right hand chart shows the Eurozone (not the EU but those countries using the euro). We know that Germany is now in recession and this is confirmed by the Blue LEI line heading downwards.
Purchasing Managers Index (PMIs)
(Source: Bloomberg)
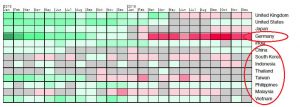
In prior newsletters we have highlighted the PMI index as one of the few useful forward-looking indicators.
This graphic from Bloomberg shows the recent monthly trend across the globe.
Below 50 (in Red) the PMI is declining and hence an economy is in danger of heading into recession.
There are several points to take from this graphic, clearly Germany and thus the Eurozone is in a bad place. The UK is slowing as is Japan. However, the dominant global economies of the USA and China are still indicating growing economic activity, as is India.
Since early 2019 all countries have experienced economic stagnation with the main culprit being the trade war.
Given the current ceasefire it seems reasonable to suggest that many, especially those economies in the South East Asia, should soon turn Green.
Brexit
The success of the Conservatives in the General Election has given Boris Johnson the majority he wanted and one that is pro-Brexit as well.
We have to now assume that Brexit will finally take place on the 31st January and the UK economy will then enter into the transition period.
There were initial hopes that as he no longer needs the support of the ERG (hard Brexiteers) and the Northern Irish DUP he might choose a “softer” departure strategy in order to just get Brexit finally out the way, hence the strong pound.
However, Boris announced a deadline of the end of 2020 to complete a trade deal.
This has raised fears that it is a “hard” departure in disguise. The markets, however, suspect not. Boris used this tactic before in order to get concessions from the EU last October, also we know the EU will not make decisions until it has to, hence the need for a deadline and finally it is perhaps an attempt to break Barnier’s “sequencing strategy” i.e. “we need to agree this before we move on to that”.
Trump has also shown that basic trade deals can be done in a short time and the UK markets have now priced in a UK/EU “phase 1” deal by the end of the year.
With a new EU President, Germany in recession and the EU now in Trump’s sights for a trade war, there are incentives on both sides to get a deal done, but, as we have always said, it will be at the very last minute.
US Presidential Election
3rd of February marks the start of the lengthy US Presidential Election process.
So far we know very little, Trump seems secure as the Republican candidate, as he is likely to avoid full Impeachment in the Senate.
For the Democrats the race to be candidate remains wide open. The markets would not like a candidate from the left wing i.e. Bernie Sanders or Elizabeth Warren.
It is interesting to note that odds for both widened after the UK General Election. The thinking here is that the Brexit referendum foretold Trump’s victory so the same might happen again? Just like the UK, who will be the next leader is decided not in the big cities but in the old industrial areas (US “rust belt”) and the farming states.
Markets wouldn’t mind a centrist Democrat, just not a socialist one. This will be a fascinating campaign, but potentially a risky one for equities and bonds.
No doubt we will have “full-on Trump” and having seen how important his tweets were during the trade war, markets might well become very sensitive to them again during the campaign.
Having said that, Trump counts a strong S&P 500 as one of his key successes.
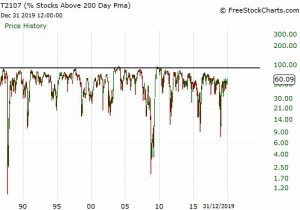
% of US stocks above their long term average
This time last year we showed this chart and highlighted the spike down in this indicator. It shows the number of S&P 500 companies that are above the 200 day moving average of their share price.
This average is widely used to define whether a share is in an uptrend or not, why 200 days, well that’s roughly a working year.
We do know that the trading robots use a complex combination of indicators such as this in order to direct order flow into the markets.
As equity markets have rallied so has this indicator. Revisiting it, we can see that it is no longer a screaming buy, but neither has it reached a difficult level for markets.
Climate Change, ESG Investing and Taxonomy
As we highlighted last month Green New Deals are becoming politically popular as a means of economic stimulation through the back door.
Now, in Europe at least, it is not a question of whether an investment manager or company Chief Executive believes in climate change, it will be forced on them.
The investment markets were unsure whether climate change is down to the natural rhythm of the planet or carbon emissions.
They are wary of yet another media “cause celebre” and thus default to focussing on returns.
There are also big performance issues if say oil and mining shares are excluded from portfolios.
Many fund groups had already launched “new style ethical” funds termed ESG (Environmental, Social and Governance). For many financial advisers and their portfolio managers these funds are too small, have too short track records and often struggle deliver true ESG mandates.
But things are changing.
In Europe where the stimulus is needed most, the EU has proposed “a regulation on the establishment of a framework to facilitate sustainable investment (taxonomy regulation)”.
In a nutshell this seeks to clearly define what is “green” and what is not.
Once this is done it forms the basis for taxation and regulation both supportive and crucially, punitive. This may seem a small step, but is the first stage of a process that will touch many mainstream investment portfolios for decades to come.
Investment Strategy for 2019
Bonds: The outlook for bonds depends entirely on inflation. Any hint that it is starting to pick up again then bonds are overextended and have to fall. The global experiment with negative interest rates is starting to be pulled back with Sweden the first, so far, to give up. Markets in general are still watching the US Bond Spread i.e. 2 Year US Treasury Bonds yield 1.5% whereas the 10 year yields 1.7%. If the 2 year yield moves above the 10 year then that predicts recession.
For this to happen, either inflation would have to accelerate or growth to collapse. Bond markets assume that growth will pick up post the trade deal, will they be right?
UK Equities: Virtually all independent UK economists both before and since the Referendum have stated that Brexit would be bad, but not that bad and PROVIDED the right policy initiatives were taken could ultimately be good for the UK economy.
We have to assume that a trade deal will be signed, therefore it is what else Boris intends to do that will dictate how the UK grows over the next 5 years.
We haven’t had a Budget yet so we have no facts to form a view. Hopes are though high and UK shares are undoubtedly cheap by international standards. Whether they catch up depends if Boris can deliver actions that match the talk.
Global Equities: The outlook is now becoming very region specific. The US with “big tech” still looks like the leader, we need though to watch for dollar weakness. If the reserve currency does fall relative to others then we would expect the Far East to accelerate.
Europe, has many, very successful, cheap companies but is the only major bloc facing imminent recession, has a weak banking system and political instability.
Japan, might just be starting to show some growth but remains the model that most economies are seeking to avoid.
China had been the “cream on the top” of global growth. Post the trade deal the Chinese are stimulating their economy and if this works could may well make the difference for all global economies in 2020.
Summary: As we write the new decade has started with a US attack on Iran, the Iranians had been goading Trump with a series of terrorist attacks over the past few years and following the most recent one, he finally bit back.
The US has taken out a very high profile target and as such raised the stakes significantly. Why now? The US election starts next month, Trump is being impeached and the China deal (Iran’s ally) has been almost put to bed.
Generally, these things blow over, but we are dealing with Trump, it just how far either side is prepared to push it in an election year?
For markets wars tend to be nonevents, we did see with Gulf War 2 a delayed recession recovery as the uncertainty weighed on markets, but they soon bounced once the invasion started.
But we are nowhere near that, the market risk will come from a rising oil price stoking inflation. On balance, providing this doesn’t escalate too far, markets should be okay with what’s going on.
Markets entered the year on a high with euphoria, not as yet supported by hard profit and economic data, it should come. We need to remember US elections are long and drawn out, who the Democrats choose may well be the defining event of 2020.
January 2020
Click Here for Printable Version
This information is not intended to be personal financial advice and is for general information only. Past performance is not a reliable indicator of future results.

