Click Here for Printable Version
It is only with the benefit of a few months of hindsight that we can judge where we might be on the market roadmap. It currently appears that US interest rates actually peaked in July when rates were last raised to 5.5%. The market though thought differently, it had priced in further rises.
It is thus not the reality that tells us where we are but what the market thinks or believes. The recent Israel-inspired panic selling of the US 20 Year Treasury Bond meant that it had fallen in value by 50% from the Russian invasion of Ukraine.
This represented a classic “buying point” and long term investors, crossed their fingers and bought. This bravery has so far been rewarded, market interest rates thus peaked in October.
Equity markets have also bounced and whilst the main beneficiaries have been the big cash generative tech companies there are now encouraging signs that this recovery in bonds is being translated into the wider market.
Crucially, mid and small sized companies are starting to find support. Furthermore, the mighty US dollar has suddenly turned weak, another classic sign that “hot -money” is starting to be more adventurous again.
Yet another positive sign is that the Gold price has sprung to life.
Gold is much misunderstood, even by market professionals. The markets are believing, at least for now, that the Central Banks are done raising rates. The European Central Bank has been the most explicit in saying no further rate increases, but then Europe is the only major economic area actually in recession.
The Bank of England was always a reluctant raiser of rates and crucially the US Federal Reserve Bank seems to have moved from saying “further rate rises might be necessary” to “don’t expect any cuts anytime soon”. The Portfolio Roadmap is based on long term historic patterns with 18 months being the average time fame.
If interest rates have peaked then it took 17 months for the Fed and 20 months for the bond markets to complete their Bear phases.
Was that it? We will only know with the benefit of a few more months of hindsight.
Goldilocks and the three Bulls
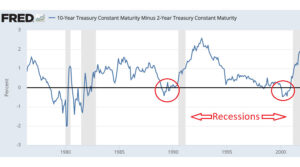
This chart from the Federal Reserve Bank of St Louis shows the difference in yield between the 2 Year US Treasury Bond and the 10 Year.
Normally, the yield on the 10 year is higher than the 2 year in order to compensate holders for tying up their money for 5 times longer.
When the reverse happens that historically is an accurate indication that a recession is coming.
This is when the blue line moves below the black i.e. the 2 Year yields more than the 10 Year.
It is predictive, the move occurs on average around 18 months before the recession actually arrives.
Also when the trend starts to reverse (red circles) it represents a buying signal, as it always occurs just as the recession arrives, it means that interest rates will soon be on their way down.
It might be different this time, but those remain the most dangerous words in investment.
What are the possible Scenarios for the markets from here?
1. Markets currently believe in the “Goldilocks” i.e. inflation coming down to target and yet the US economy manages to avoid recession. If so, then the Fed isn’t likely to cut rates too fast, too soon. They wouldn’t need to and their fear of inflation will outweigh any minor negative economic consequences. Moderately good for markets.
2. Economics turns out to be right and a recession hits the US economy during the first quarter of 2024 (as the above chart is predicting). The Fed puts the economy first (especially as it’s a Presidential election year) and cuts interest rates sooner and faster than is currently priced in. If we are being disciplined and following the indicators rather than wishful thinking, this is the most probable of these four scenarios and is actually the best for markets.
3. The Fed has made a mistake and done too much. The US economy nose dives into a severe recession and possible Credit Crunch. (US Banks are sitting on c$550billion of unrealised bond losses on their balance sheets). Not only will interest rates have to be cut very rapidly the Fed might even have to start Quantitative Easing again! Bad for companies, but actually good for markets.
4. Inflation isn’t beaten, it comes back with a vengeance and the Fed is forced to keep raising rates regardless. Not good for markets.
So we are entering a stage when most scenarios are positive for markets, the proviso is that inflation has to stay low. There are currently clear signs that economies globally are slowing. Walmart warned on profits as the US consumer tightens it’s belt.
WeWork is the biggest bankruptcy since the Credit Crunch, defaults are rising and bank balance sheets are under stress.
Meanwhile commodity prices including oil are depressed, helped by China’s lacklustre reopening. The main issue with inflation now is property rental costs, both in the US and the UK, here the post-Covid surge does seem to be slowing
Gold
Gold is not an investment, it is a commodity and used mainly for trading. It pays no interest nor dividends and for the big investors is expensive to store and transport.
It occasionally has bursts of activity and most textbooks say it is best used as a hedge against inflation. This might have been the case decades ago but in modern times it is primarily used as hedge against dollar weakness.
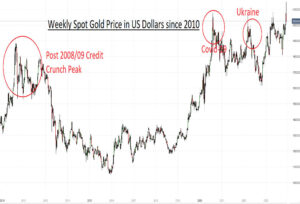
In fact, as this chart shows, as inflation took off after the war in Ukraine, Gold went down.
Buyers do now seem to have returned and just as the dollar has begun to weaken. This so far seems to be more than the usual knee-jerk response to geopolitics.
We did see a similar performance pattern in 2009, just as markets started to recover from the Credit Crunch.
Gold didn’t peak until some two years later in 2011, which is just where this chart starts.
Markets
Whilst US equity markets appear to have made progress, the reality is they haven’t fully as yet.
The big seven tech companies that operate in their own economic universe are of such a size that they have driven the indices higher.
However, most of the other 493 shares in the S&P 500 have just gone sideways. It is only now that we are starting to see some buying interest, in particular mid and small cap stocks are starting to move.
Biotechnology another sub-sector that has fallen by 50% is now finding buying interest, as are the UK Housebuilding stocks which we highlighted in October’s newsletter.
Both are classic early cycle movers in markets. If we then add in support for Gold and for long term bonds then we have an emerging picture of a broader, healthier development. It is still very early days and we are in the seasonally strong period of November to January.
Markets do seem, however, to have reached some sort of inflection point as interest rates appear to have peaked globally.
Market perfection would have the US entering a mild recession in the next few months. If it does then the Fed will have returned interest rates and bond yields back to pre-Credit Crunch “normal” with relatively little collateral damage.
It is, however, a fine line between success and failure and the Fed won’t truly know whether they have done too much, too little or got it just right for a few months yet.
Markets do though appear to be getting into the position of whatever happens economically (bar accelerating inflation) long term investors should be rewarded over the next few years.
December is often one of the best months of the year, the traditional Santa rally usually starts just after the last Options and Futures Expiry Day, which this year on the 15th of December.
As we said last month, for long term investors the “ducks continue to line up nicely”.
December 2023
Click Here for Printable Version
This information is not intended to be personal financial advice and is for general information only. Past performance is not a reliable indicator of future results.


