Click Here for Printable Version
2023 eventually turned out to be a positive one for investment returns, helped by a Santa Claus rally and crucially, for the first time since the invasion of the Ukraine, by the all-powerful US Federal Reserve Bank (the Fed).
Whilst a positive outcome is obviously welcome, 2023 has proven to be a hugely complex and difficult year for both investors and traders, with logic and long established historic patterns constantly questioned as markets “flip-flopped” based on the economic data and subsequent actions from the Fed.
The starting point for this difficult period began on March 17th 2022 when US interest rates went from 0.25% to 0.5%, by December 2022 the rate had risen to 4.5%. There were further increases in 2023 taking the rate to 5.5%. The simple fact is that if interest rates go up, equity and bond markets go down.
However, more often than not the market’s expectations varied widely from the Fed’s reality, hence the big swings in bond and equity prices.
Traders emotions tend to move from one extreme to another, many times the US was “definitely” going to avoid recession, at other times the market was “certain” a recession was imminent!
Markets are, as ever driven by fear and greed and we had both in abundance during 2023.
Every inflation related economic statistic was forensically analysed for changes in underlying trends.
Used car prices and rents were watched particularly closely for signs of “embedded” inflation. For UK consumers the media made much of the “cost of living crisis” but then again did little analysis as to what was actually driving it. This just added to the “fog” that pervaded most of the markets on 2023.
The overall picture remains a very confusing one. The actual economic statistics paint a picture of modestly healthy US and UK economies (the UK yet again doing better than forecast). In marked contrast the forward looking data, based on company surveys, remains pessimistic.
Who is right?
Again based on historic timeframes, it is still too early to tell. But something in the data seems to have worried the Fed, as not only have they stopped raising rates (last increase was in July) they have now told the markets they expect to cut rates, possibly three times, in 2024.
None of this is out of the ordinary, it is only with the benefit of hindsight that we can see that yet again the historic patterns have worked. It is these patterns we use in our rough Portfolio Roadmap, with 18 months the most repeated time period.
Portfolio Roadmap
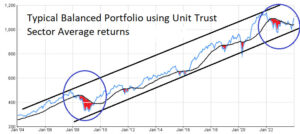
This chart shows a typical Balanced Portfolio (Bonds, Equities and Property) built using the Investment Association Unit Trust Sector Averages.
It is not a client portfolio but it does reflect the general trends and turning points.
There are several key points that can be read from this chart.
Firstly, the events of the last two years are not abnormal. There is nothing in the pattern or the long term trend to suggest that the concept of a long term, properly diversified, balanced portfolios should be questioned.
If we ignore the Covid 19 period of 2020 then patterns of performance are exactly in line with long term trends and historic volatility levels.
Secondly, as we have highlighted many times in previous newsletters, certain timeframes do repeat in the history of Bond and Equity markets.
As this chart shows the current movement from the top to the bottom tramline is remarkably similar to the Credit Crunch period of 2008/09. Then markets turned as the Fed released cash into the global economy through Quantitative Easing, it is now forecasting to do the same through interest rate cuts.
Markets are not predictable, however, we have seen these patterns of portfolio performance many times before. It does look as if we are in a period where the long term up trend should reassert itself.
Bonds
Bonds form the bedrock of a portfolio, they are historically lower volatility and have a lower risk of total capital loss (i.e. US and UK governments have never gone bust).
If investment theory is correct, then gains and losses should be low as well. For once, in 2022 and 2023 they delivered very high losses and very high levels of volatility.
Why? A decade of Quantitative Easing had meant they were mispriced, also Covid-19 caused a final flurry of demand as equities fell sharply.
As interest rates went up and by more than the markets initially thought, bonds had to fall in value.
Long dated bonds and index-linked bonds fell the most. The US Treasury Bond market dominates the investment world, it sets the direction and level of interest rates globally, including UK mortgage rates.
This chart shows the key iShares 20 year Treasury fund, it is the largest single bond fund and is used in most complex hedging strategies.
To fall by 51% is extremely important and may yet lead to severe repercussions.
US Banks were, at the low point, estimated to be sitting on $650billion of unrealised Treasury Bond losses. The recent bounce may have reduced this negative balance sheet item to $550billion.
It may well be this fact that has allowed the Fed to signal a decline in interest rates this year. Gilts were not as badly hit but still declined in value by around a third. This signal from the Fed has sparked a bond rally which has helped equity markets as well.
Everything in the global financial world is hostage to the US Treasury Bond market, for it to have declined in value at the long end by 51% is very significant.
The true cost for banks, governments, property investors, infrastructure projects etc. may well start to be seen in 2024. However, for equities, as we have shown many times before, markets historically resume their uptrends as and when interest rates peak, that is exactly where we seem to be now.
US Technology Equities
There were two equity markets in 2023, i.e. the big seven technology companies and then there was everything else. Why?
There are two factors here, firstly the biggest companies Apple, Amazon, Alphabet, Meta, Microsoft and Tesla were still growing, had no debt and generate huge levels of cash.
In Apple’s case more than a medium sized European country. As bonds were falling these cash flow characteristics were seen to be very valuable. Then there was another catalyst that “lit a fire under” these stocks.
Microsoft invested an estimated $10 billion into a non-profit company, Open AI. This gave it access to the groundbreaking software behind ChatGPT. This has set off an Artificial Intelligence “arms race” with Cloud operators racing to buy Nvidia’s microchips in order to build AI processing capacity.
The pace of AI development is now much quicker than previously thought, hence Nvidia joining the exclusive tech “top table.” But there is a price for everything, and since the reversal in the 20 year Treasury Bond, investors have started bargain hunting elsewhere.
UK Equities
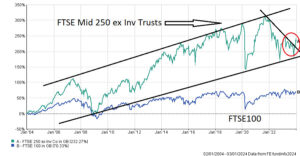
In a recent newsletter we highlighted the underperformance of the usually top performing global Mid and Small Caps. Having completed classic c30% drawdowns, the Fed’s pivot towards cutting interest rates has led bargain hunters to start buying. In the UK the key Housebuilding sector is leading the way.
This is after share prices fell more than in 2008/09 and company market capitalisations fell below land bank values.
As this chart shows, the FT Mid 250 is now bouncing off the same trend support that it did curing the Credit Crunch and Covid-19 sell-offs. Much will depend on the Bank of England cutting rates, which in turn depends on inflation. This mid and small cap pattern is being replicated across the globe.
Europe
Europe is the only major economic bloc actually in recession. German manufacturing is struggling from rising energy prices and poor demand from major customer China. France is in similar situation with luxury goods companies in particular hit hard by China’s slow post-pandemic reopening.
However, this does give the ECB scope to cut rates faster and deeper than the US. To do so will depend on inflation and for Europe that depends on the gas price. It has been a relatively mild winter so far and gas stockpiles seem to be above normal for this time of year.
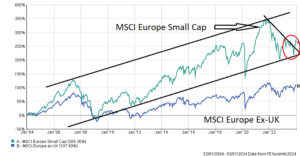
As in the UK, Small and Mid-Cap stocks look to be starting to outperform again, after a 33% drawdown.
Politics
2024 will be a year of elections, in the West it will be dominated by the US Presidential election in November.
However, the American election process is a lengthy one and if anything it will be the Party candidate elections that will be of uppermost interest to markets.
There are arguments against the two most likely, Joe Biden and Donald Trump, at present.
Indeed some very influential Wall St. grandees are endorsing alternative candidates for both the Democrats and Republicans. The news flow here will add to market volatility at a point in the cycle when markets are traditionally more volatile than normal. In the UK a General Election has to be held before January 2025 and the “usual” months for an election are May and November.
Economically a giveaway Budget is widely expected in March. This month also sees a Presidential Election in Taiwan, the result of which may well impact investors views towards the underperforming Chinese stock market.
Far East and Emerging Equities
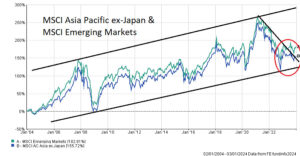
This chart of both the Asia Pacific and Emerging Market large company indices looks remarkably similar to the UK and Europe Mid and Small Cap ones from above.
This is no coincidence, all benefit from lower interest rates and a weak dollar. Just as in the UK, Europe (and US Mid and Small Caps as well) it is showing signs of out-performance as interest rates peak. This is despite onshore Chinese stocks lagging behind as the Chinese economy struggles to recover from the prolonged Covid-19 lockdowns, US sanctions and ongoing property issues.
China will at some stage unleash significant economic stimulus, it just never does it when markets expect. As and when it does, these regions should follow the US, UK and European Mid/Small Caps and resume their long term uptrend.
Property and Infrastructure
As is always the case Direct Property was the last sector to fall, fund prices are set by surveyors valuations rather than day to day market prices.
When this type of fund falls then we are normally towards the end of down cycle for equities. As interest rates fall this sector will return to favour.
Another surprising casualty of the sharp rise in interest rate was Clean Energy Funds.
Despite the global government-led dash toward green power and energy security politicians failed to understand the pricing dynamics of this complex market. Electricity subsidies were slashed on new projects despite higher interest costs, unsurprisingly, this led to a moratorium on new wind and solar farms by developers.
Political sense seems to have prevailed and investors are now back buying wind farms at bargain high yields.
Investment Markets in 2024
In last month’s newsletter we outlined 4 broad scenarios for the global bond and equity markets:-
- The Goldilocks i.e. Inflation keeps falling and yet recession is avoided
- Economics is right i.e. the US and UK will join Europe in recession during early 2024
- The Fed has done too much i.e. a major financial crisis arrives as banks see a wave of defaults
- Inflation returns i.e. inflation isn’t beaten and comes back with a vengeance
Markets still do not know which of these is right and no doubt there will be times this year when each one will appear to be correct.
If history is a good guide for the markets, as it nearly always is, then the second one has the highest probability of being right. However, so far there has been nothing in the stats to suggest anything other than the Goldilocks will be the dominant theme, but, it remains too early to tell.
For investors there are huge opportunities to be had, especially outside the large caps.
But to reap these rewards will require a long term time horizon.
The percentage upside, just to get back to where they were before the Ukrainian invasion, as the above charts show, is huge, not just for one but for a wide range of bond and equity markets. It will, however, be a tricky year with both mainstream politics and geopolitics to deal with. This suggests that volatility is likely to be higher than usual. However, if inflation stays low, then interest rates will come down and thus markets will go up.
If a recession or indeed a Credit Crunch arrives then these same interest rates will be going a lot lower. If investors remain patient, the rewards will come. It all depends on the data.
January 2023
Click Here for Printable Version
This information is not intended to be personal financial advice and is for general information only. Past performance is not a reliable indicator of future results.


