
Click Here for Printable Version
April was a very messy month for Global stock markets. There was so much going on, with much of it contradictory no-one knew which way to turn so ended up doing nothing or taking a bit of risk “off the table”.
We had the US corporate earnings season, the US Treasury Yield Curve flattening; Trump and the FBI; Trump’s trade war with the Chinese, Mexicans, Canadians and Europeans; mixed economic numbers and the fretting about the ending of easy money. Most investors have a very short financial memory; they cannot remember the world before the Credit Crunch and the advent of QE.
The assumption is that as QE tails off then so will the markets. The reality is that there was an investment world before 2008 and it was dominated by earnings growth and inflation.
We are now just starting the process of rebalancing investor’s market psychology back to pre-2008 thinking.
This may take some time and they will also need to re-programme their trading computers.
QE and Markets
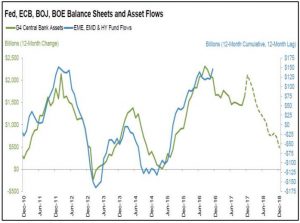
Source: Financial Sense
It combines all the various global QE programmes and compares them to the volume of money flowing into the riskiest
investment assets i.e. Emerging Markets Equites and Debt and High Yield (Junk) Bonds.
When it is skewed by 12 months there is a remarkable correlation between the two charts. Given the projections for a global reduction in QE then the argument is that fund flows will fall and thus so will stock and bond prices.
The problem we have with this is, by skewing the fund flow chart is it distorting the truth to fit an argument?
Likewise we have only had QE since 2009 so is it statistically relevant? We publish this chart only to show what the doomster negative view of markets is based on. There was an investment world before QE and it went up quite
nicely!
The Yield Curve
A yield curve is a chart that shows the various rates of interest you receive depending how long you tie up your money for.
So to invest your money for 10 years you would expect to receive a higher rate of interest than for a two year deposit.
The same is true in the market.
But if you think a recession is coming and thus interest rates are going to fall, a lower but longer and guaranteed fixed rate becomes very attractive.
So when this happens in the bond market it is a clear sign that traders think a recession is coming
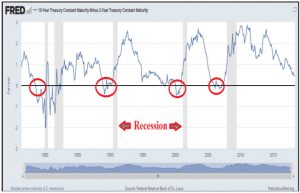
Over the past 40 years, when the 2 year has yielded more than the 10 year then about a year or so later the US enters recession.
Historically, this has been a 100% accurate indicator.
Presently, the gap is narrowing, but is still a long way from inverting.
Indeed in the 1990s it took nearly 5 years from looking like it might invert to actually doing so and then it was nearly another year before the US went into recession.
So the message here is that it looks as if it might be getting ready to invert but not just yet! In the complex interest rate Swaps market there is a minor inversion in 2020. So that is what the markets are pricing in for now.
The problem we have with this market view is that 2020 is a US Presidential Election year.
Trump, if he is still there, will no doubt have tried to engineer an economic boom.
This would mean that 2021/22, as is now traditional, would see a US recession,Presidents like to get the bad news out of the way early in a Presidency!
US Company Profits
With 65% of the US first quarter corporate results in, the numbers have been spectacularly good.
The Trump tax cuts have boosted the numbers but underlying growth has crucially been very good as well.
Why does this matter? Share prices are not made up; they ultimately represent the profitability of their business.
For share prices to keep going up, so must company profits. Annual operating earnings per share in the first quarter jumped from $28.82 to $37.50 and forecasts for next year raised to $40.25.
These are some of the best growth numbers in decades.
The forward valuation (price/earnings ratio) has now fallen to 16.5 times. So whatever other issues the market is facing at the moment there is no problem with growth or valuation, which ultimately is what investors are buying.
Harley Davidson
In the past we have highlighted this US motorcycle manufacturer all a bellwether for the US consumer.
No-one actually needs a Harley but they are affordable for the majority of US consumers.
Recently sales have flat-lined which has proved to be a good indicator as so have US consumer sales.
Recent figures showed another minor US sales decline to 29,309 from 33,316 motorcycles.
But they held market share. Forecast shipments for the year were maintained which indicates they expect US consumer spending to pick up.
For the markets worrying about inflation, it shows that the modest increase in wages has not as yet translated into extra high street spending.
Trend is your Friend
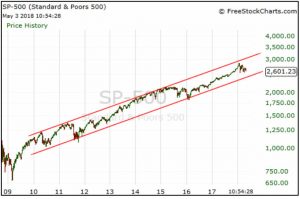
The USA makes up 50% of the World Stock market Index so it really does dictate global investment returns.
Since the end of the Credit Crunch in 2009 it has been a wobbly line upwards but in a constant trend.
There have been plenty of corrections along the way, and there will be plenty more.
So far the trend is intact and thus so is the cycle. As ever these trends are broken by the Central Banks who have to react to accelerating inflation. For now, at least, even though the cycle is very mature, inflation and thus the Fed remain subdued.
This will change at some point. Some are guessing it is imminent, it is often best to wait for hard facts.
Markets
Markets are still in correction mode and we are now entering a period of seasonal weakness i.e. “sell in May”, so far in percentage terms this down move has been modest.
Normally, these moves are about 15%, we have had less than 10%.
As the above chart shows even if we were to fall further the market would still be in trend.
For now the bond markets will be concentrating on the yield curve, if the consumer starts spending again and inflation moves up then so must bond yields.
If they do move up then it brings the next recession closer.
For equities the news flow will be dominated by the China trade talks, any positive developments will be very well received by the markets.
But also we need to be aware that this also has the potential to extend the correction as well.
Trump just doesn’t do things the normal way, he goes into trade talks and immediately doubles what he wants, markets simply don’t know whether to trust his judgement or not.
The Chinese will be no push over and there is a risk they devalue the Yuan, which has the potential to destabilise global markets in the short term. So as we enter the quieter summer trading period there is still an awful lot of noise around.
April 2018
Click Here for Printable Version