
As the third quarter of 2015 passes global markets remain in correction mode.
The deflation doomsters are back out in force suggesting that QE hasn’t worked and the markets are predicting a recession in 2016.
Does a decline in the S&P 500 automatically predict that a global recession will soon be at hand? Not according to history, analysis shows that while all recessions were indeed preceded by corrections or bear markets, there were nearly three times the number of 10% plus market declines than there were recessions.
So since 1948 there have been 31 stock market declines in excess of 10%, however, there have only been 11 recessions, including minor ones.
The old adage that “Wall Street has predicted nine out of the last three recessions” has to be born in mind when making investment decisions!
The Big Picture
As ever in the stock market, history can guide us in one particular direction or another but what has happened in the past is rarely accurately repeated. History can be an indicator of a forthcoming recession but also it is not a very reliable one!
The natural flow in markets is upwards, why, because the constituent companies make bigger and bigger profits and thus payout bigger and bigger dividends and so become more valuable.
The market, for now, is of the opinion that deflation is the dominant theme and there is nothing Central Banks can do about it.
Thus, next year’s multinational corporate profits might be down and this has not as yet been fully “priced-in” and therefore markets have to fall.
This is not a new view, we have heard it often during this cycle, it is part of the regular emotion of the markets, the flip from greed to fear and back again.
We just haven’t heard it for a while. It is, however, an opinion, based on a subjective view of what may happen over the next twelve months, until we have hard facts that support this view, it is a guess.
the S&P 500 since 1900
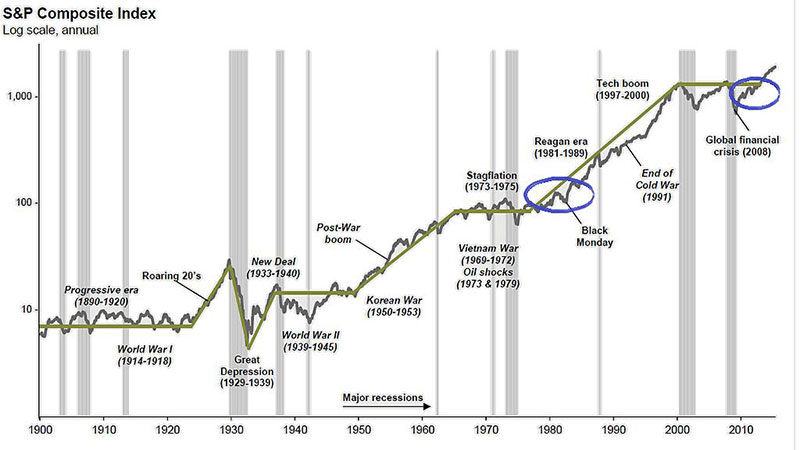
- The green line shows that the majority of the movement in this index is upwards
- The blue ovals highlight that within this trend there are regular corrections and these also occur within periods of economic growth as self-doubt becomes the dominant emotion
- The grey bars are the major recessions
It is important to constantly remind ourselves of what we are trying to achieve with investment portfolios.
The best returns over the long term come from the stock market, but to give us the best returns these markets like to inflict some pain on us every so often.
The classic mistake many private and indeed professional investors make is that they allow emotions to take over from economic reality and get “bumped off” the trend as they become fearful of giving back gains or of making losses.
Also as we have talked about many times before companies pay dividends and there is a mathematical formula that states that a company’s current share price is the discounted value of all its future dividends.
That is what we are buying into when we invest on the stock market, the future dividends and the value the market places on them.
Given that we are living longer then to achieve the best possible returns we have to stay invested for as long as possible.
As Warren Buffett says
“it is not market timing, it is time in the market.”
Manage Volatility?
If we undertake a statistical analysis of equity markets we know that a normal swing is +/- 15%, therefore we should
expect short term movements of this magnitude in the value of the equity section of portfolios.
It is the price we have to pay for achieving the best possible returns. The way we manage this volatility is through the mix of assets in a portfolio not through trading.
It must be noted that the underlying equity fund managers within the individual unit trusts will be trading and this will be reflected in their relative performance.
We, however, seek to balance out equity swings through holding Fixed Interest, Money Market and Absolute Return funds and vary this amount according to your needs and time horizon.
A trade involves four decisions, what to sell, what to reinvest in and then to reverse each of these transactions, and then do it again and again. We know markets are not predictable and move by 2-4% each day, the probability of getting every one of these trading decisions right is very low. Fidelity Investments has famously researched the cost of “missing out”.
Over the past 15 years the average annual total return (including dividends) from the FT All Share index was 4%, miss the best 10 days each year and that return falls to 0%.
Suffice to say volatility is best managed through careful financial advice and appropriate asset allocation rather than potentially expensive trading.
We are after all investing in real businesses, not the stock market, which is just a pricing mechanism.
Corporate Profit Forecasts by Sector for Q3 2015
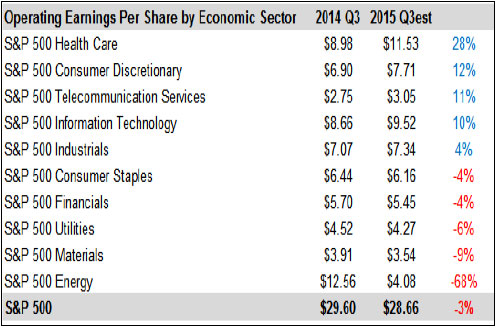
The market is expecting the combined index to report a 3% fall in profits. But, the index is weighted according to size of the company.
This means that the Energy sector which includes such giants as Exxon (Esso) and Chevron (Texaco) will have a big impact on the overall number.
Given that earnings from this sector are forecast to be down by 68% on this time last year then it is hardly surprising that the total number might appear poor.
The majority of the other sectors are forecast to show reasonable growth or at worst small declines. So on balance corporate profits might not be so bad after all?
Markets
The final quarter marks the start of positive seasonality for global equity markets, and perhaps the most important
corporate earnings season of the year.
The global economy, whilst not exactly booming, suggests that corporate earnings should be better than they have been.
As we have shown above, oil companies have had a distorting impact on the numbers.
Markets were confused after the last US FOMC meeting when the Fed didn’t increase interest rates as expected.
Subsequent economic stats have cleared the fog; the US economy is simply not growing as fast as it was.
But it was the uncertainty that the markets didn’t like and whilst the numbers have been disappointing the markets
now have greater confidence as to where we are in the cycle.
Suffice to say, based on current data, the US does not appear to be facing either deflation or inflation and thus interest rates can stay lower for longer.
Not a great economic background but not a disastrous one either. Moreover, if we can get some similar clarity from China, about the strength or otherwise of their economy then perhaps markets might be emboldened enough to resume the
uptrend?
We do though need the US corporate results season to turn out to be fine.
If all these pieces of the jigsaw fall into place then perhaps on reflection we can characterize the August correction as another “Flash Crash”.
Blame can again be attributed on the computerised trading robots. But the “doomster” deflationists have not gone away, as yet.
If corporate earnings fall again and this malaise spreads beyond the commodity sectors of Oil and Materials then
we may have to take such pessimistic souls a bit more seriously.
But the Big Picture chart does tell us that they do swim against the long term tide.
September 2015
Click Here for Printable Version