Hard to believe from the press but the FTSE100 has gone nowhere for a year now, with a modest gain of under 3%. The markets have been consolidating their gains as US QE comes to an end. We have to be wary as it is now 5 years since the market bottomed in March 2009 and we are entering the “danger zone” of the cycle. There are some signs of froth out there, social media technology companies are valued at “bubble levels”; London trophy property prices are booming; private equity firms are selling holdings via flotation, and recent new issues such as Candy Crush game maker King Media have collapsed.
But market valuations remain reasonable with the key US index valued at 15.4 times with 12% underlying profit growth forecast, this compares to a top of the market valuation of say 18 times.
Sentiment Cycle “Fear and Greed”
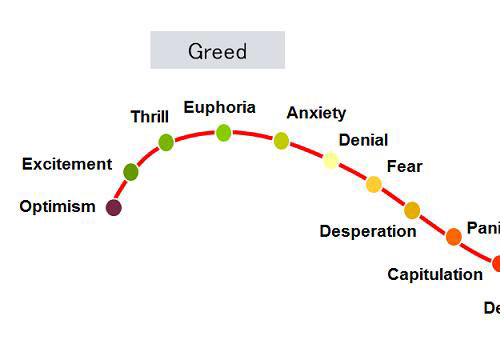
The cycle so far has been an odd one, the recovery from the Credit Crunch has been fraught with “fear”, whether it was from Dubai defaulting on its debt, Greece and the other PIGS nearly bringing the Euro down, Cyprus bailing in bank depositors setting a dangerous precedent, China initially driving the recovery then throttling back due to inflation, and now trying to keep the economy growing at 7.5% whilst taking the shadow banking debt out of the system. There has been a lot to be worried about.
But as the old adage says, Bull markets do climb walls of fear and worry. The biggest danger now is complacency, particularly as the QE safety blanket is being pulled back. The fundamentals are sound but some do question whether the 5 year Bull market has just been QE based financial engineering? This could be just another fear for share prices to work through.
With valuations reasonable, as long as governments do not tighten monetary policy too early and too quickly the Bull market should be safe for now. In the very short term though by many measures it is over extended and as we have said several times before a pullback would be healthy.
Academic Investment Research
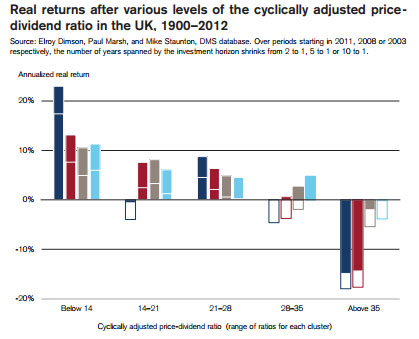
Given the financial importance of the equity markets and the potential to make money, the lack of pure unbiased academic research is quite staggering. Perhaps it does take place but the research results are kept hidden away within the sponsoring banks or fund managers. One exception is Credit Suisse which took over the annual Global Investment Returns Yearbook and works with London Business School’s acclaimed Elroy Dimson, Paul Marsh and Mike Staunton. The latest yearbook included an article that looked at the behaviour of investors and the psychological reasons why there is a tendency to buy after the market has risen and sell when it has fallen. There is a part of our brains known as “the interpreter”. Its role according to neuroscientists is to assign a cause to every effect that the brain sees. Generally it associates good results with lots of skill and bad results with a lack of skill. This causes us as investors a problem, as stock market returns, particularly over the shorter term, are statistically random.
That means that on a daily basis there is little, if any, relationship between skill and returns. However, this is not true over the long term. But the brain’s interpreter construes that a positive return, that is merely due to luck, as something good and skilful. Thus, spurred on by the interpreter, private investors tend to extrapolate short term market results, and buy or sell accordingly. They are also encouraged to do so by unit trust companies and Isa providers in their marketing. The longer the time frame we can take, the less random are share price movements. The following chart calculates how much it costs investors to follow such a strategy. It adjusts the market returns by how much new money is invested in each of these markets over the past 20 years, and weights the return accordingly.

equities before costs should have returned around 7.7% p.a. If we then take off fees and the cost of trying to time the market, the returns are no better than inflation. Please note a return of 7% p.a. over 10 years “doubles your money”.
The problem of the “interpreter” is that it takes a short cut and just concentrates on the outcome and not the reason for the result. If two football teams play a match, one dominates the game playing beautiful, skilful football but can’t score, and by pure chance the goalkeeper fumbles the ball into his own net so that his team loses, then the brain just looking solely at the result, would say that the winning team is the better one and the most skilful, when they clearly weren’t. This would then become a problem if you bet on this winning team for the next match. In the short term the stock markets are full of such random results. Over time, particularly 5 years plus, the returns become far less random. How can we “overrule” the interpreter?
Markets
The first quarter has ended with the FTSE down over 2%. This shows that as the Taper progresses the market is in “wait and see” mode. The weather has started to improve and so should the global economy. But, until we have hard evidence of normal “unsupported” growth then this consolidation is likely to continue. A golden scenario of China picking up momentum and some kind of QE in Europe could though set the markets alight again. Against that we have Putin clearly wanting to take Southern and Eastern Ukraine but trying to gauge the West’s reaction before committing himself.
Nevertheless, the US market remains fairly valued and those of the Far East and Emerging markets are at a measure below that of the 2008/2009 crash, thus screamingly cheap. The Bull has not gone into hibernation as yet, and hopefully is just pausing to chew some grass for a while.
March 2014
Click Here for Printable Version