
“Price tells all” is an old market adage that suggests the market always knows best. The performance of the global equity markets during January would suggest that the global economy has a big problem and a major recession is due in the next 12 months.
Now that is always possible, but is it probable? History tells us that periods of economic growth do not die of old age, they are “culled” by the Central Banks. Interest rates have risen in the US but are falling still elsewhere in the world.
Indeed Japan has introduced a negative interest rate (in reality a charge for holding money on deposit) and Europe is still pushing on with QE.
Now the collapse of the oil price and subsequent retrenchment of expenditure on oil equipment is costing some economies and industries dear and is squeezing a lot of potential growth out of the global economy, but will this tip the USA, UK, Europe, Japan and China into deep recession?
You would have to believe it is unlikely. We are sorry to keep going on about it but the problem is not that global economy is facing recession it is that share valuations got to be too expensive for the prevailing level of corporate profit growth, and now have to go through a period of repricing.
They anticipated (and priced in) strong growth but have got anaemic growth. This is the root of the problem that is facing equities at the moment, the key US markets are expensive, and shares will therefore struggle, especially as the news flow in general is pretty poor at the moment.
The markets are acting as if a deep recession will occur in the next 12 months; is there any hard evidence for this?
US Leading Indicators
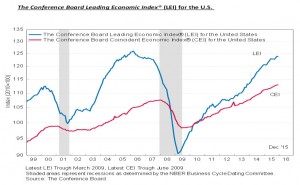
The grey shaded areas are recessions and we can see that the Blue line turns down well in advance of the recession actually happening.
So far there is no sign of this indicator rolling over.
The comments from the Conference Board were as follows: —
“The U.S. LEI fell slightly in December, led by a drop in housing permits and weak new orders in manufacturing.
However, the index continues to suggest moderate growth in the near term despite the economy losing some momentum at the end of 2015.
While the LEI’s growth rate has been on the decline, it’s too early to interpret this as a substantial rise in the risk of recession.”
Harley Davidson
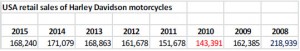
What does our usual bellwether tell us about the health of the global economy?
Firstly, current sales are still way below the pre Credit Crunch level of 2008.
Remember the stock market is 12 months ahead of the real economy so the crisis hit sales a year later in 2010.
Since then, volumes have recovered nicely up until 2013 and then have been pretty flat. It is possible that the market is predicting that there will be a sharp slowdown in sales in 2016. For that to occur we would need a dramatic rise in US unemployment and a collapse in wages, as of now that isn’t happening and it is also hard to see how it would happen?
It is not impossible just not probable based on current evidence. The message here is of a US economy still way behind where it should be and stagnating rather than collapsing. This isn’t great but, not disastrous.
Oil / China
The triggers for the day to day movement in share prices, for now, are the price of crude oil and the local Chinese stock market.
As we have written before the Shanghai and Shenzhen exchanges are casinos where share prices bear no relation to their true value, sharp moves hurt sentiment rather than have a real economic impact. For their valuation to match their Hong Kong equivalents Chinese shares have to fall a long way yet. Oil is much more important, this chart shows the crux of the current problem.
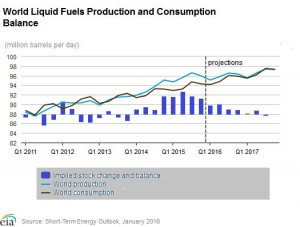
Projections are that by the end of the year demand will catch up with supply.
The “right price” for oil is around $45 to $50 per barrel which compares to the current price of about $30pb.
The sanctions on Iran have been lifted and their oil is coming onto the market, it might be that the Saudi leadership may now be more inclined to cut production.
Nigeria and Azerbaijan are struggling and need emergency loans, Russia is hoping for a sanction lifting Ukraine deal to ease their financial pressure. For now, where the oil price goes, so does the stock market, which could be painful, but as the chart shows there is an end in sight.
Market Roadmap
Markets remain under pressure as they continue to believe that a recession is coming, despite only limited evidence so far and central banks still generally in easing mode.
As we saw last month outside the USA valuations are reasonable to cheap, however the US leads the way both up and down.
Our view continues to be that all of this is just noise, the shares we invest in are currently too expensive for the level of growth that is being delivered, either growth has to go up or share prices have to go down. We have been here before it is just part of the natural rhythm of markets.
Share prices are not predictable, the biggest computers and Noble Laureates prove this on a daily basis.
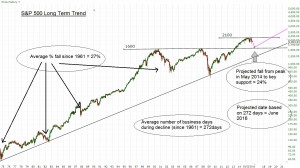
However, over the long term patterns do seem to repeat themselves.
The above chart displays a possible road map for the S&P based on fairly consistent historic averages, IF the current trend breaks.
The 1600 level would also move the PE back to a reasonable value (a recovery in oil at the same time would make it very cheap) and June rhymes with two key events: OPEC meets on the 2nd June and the likely date for the BREXIT referendum is 23rd June (local elections and football mean that this is effectively the only available date).
July also sees the party conventions in the USA.
Oil and China remain the triggers and news from these two areas will dictate what happens in the short term, June looks to be critical for the medium term.
For the long term nothing has changed, the multinational companies we invest in will keep growing and paying dividends and as such so will their share prices.
January 2016
Click Here for Printable Version