
Click Here for Printable Version
April proved to be a complicated month for the global markets. As the pandemic seems to be passing in the UK and USA, India experienced just how severe the virus could be on an unvaccinated and free moving population.
Interestingly, the dreadful news has so far not impacted the Indian stock market. Maybe markets are no longer concerned about outbreaks, believing the vaccines should ultimately deliver a solution? In the USA, as those inoculated hit 100 million, President Joe Biden announced how the fiscal stimulus could be paid for, in a nutshell tax the rich and the big companies.
Just as those big US companies announced a substantial recovery in profits.
The US results season was far better than expected and for many companies there was effectively no recession at all. Indeed, for many individuals and companies not only was there no recession, they are emerging from lockdown wealthier than when they went in.
A “normal” recession hits consumer spending power through rising unemployment, falls in property values of c20%, the banks being very restrictive and savings decimated.
This time round property prices in the UK are up by 7% and estimates are that the UK consumer has around £150billion of extra savings.
All this points to the new cycle being a particularly strong one.
The Investment Cycle
(Source: ECU Group)
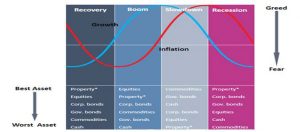
Returns from investment portfolios are dominated by the global investment cycle.
Economies move from boom to bust as central banks seek to push inflation down during a boom or stimulate the economy following a bust.
Historically the cycle turns around the appointment of a new US President, which makes sense. A boom is engineered just before an election, which stimulates inflation and thus the economy needs to be reined in, so the new President gets the bad news out of the way early.
This chart, which is many years old now shows a typical cycle based on data going back over 100 years.
It breaks the cycle down into four stages. The blue line (growth) moves 12 to 18 months ahead of inflation (red).
So where are we now?
We know inflation is starting to pick-up and growth has already been very strong.
So it is reasonable to assume that we are entering the “Boom” phase of the cycle.
This is also confirmed by looking at the asset classes. Equities are indeed doing better than bonds.
What is different this time is that Commercial Property in the UK is very mixed, whilst Commodities are performing particularly well.
But then again the last cycle did not end in the normal way. It wasn’t ended by Central Banks moving up interest rates, but by the pandemic. This meant that rather than waiting to move rates back down and start QE, they moved very early and much more aggressively than usual.
Property may have to wait for the virus to be fully under control and workers can head back to offices, bars and shops before catching up. The commodity growth is down to the global green fiscal stimulus, copper is now the new oil.
What this means is that we can have confidence that a new cycle is underway, what is more, the conditions are in place for this to be a particularly strong one. Thus, we need to be vigilant just in case this long established pattern is “different this time”. Which as we have said many times before are the most dangerous words in investment.
Chips With Everything
The news from Ford and other car manufacturers that whole plants were to temporarily shut down surprised many.
This is not due to Covid-19, but to a dramatic shortage in microchips. This shortage has led to the EU and the US to allocate stimulus funds to bring chip production back to the US and Europe. But as a recent Blomberg article put it succinctly “making chips is not rocket science, it is much more difficult”.
Three companies dominate supply, Intel of the USA, TSMC of Taiwan and Samsung of South Korea.
Each specialises in a specific sub sector e.g. Intel for computers, so they essentially have a monopoly of supply.
Apple is now looking to make its own chips and are one of the few companies that can afford to do it.
A new chip plant is estimated to cost around $20 billion to build and equip, yet could be obsolete in 5 years, this is a very high stake game.
New electric cars, 5g infrastructure, green power all need vast quantities of new chips. There are plenty of chip designers out there but very few places to make them. These factories, termed foundries are the new choke points for the global economy.
Top 20 Global Companies “then and now”
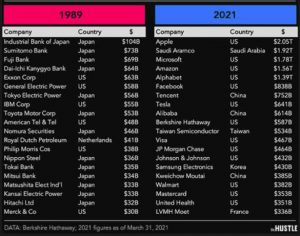
This table from Berkshire Hathaway shows the largest companies in the world in 1989 and now, just over 30 years later.
Which is interesting as this timeframe is also the typical length of an active pension portfolio. In 1989 the list was dominated by Japan, yet there are no Japanese companies on there now. There are plenty of American companies on both lists but they are all different.
The decline of oil and tobacco to be replaced by tech is also noticeable. Saudi Aramco was private until very recently.
In the UK using the FT30 index, which was launched in 1935, there are just three names that remain unchanged, Imperial Tobacco, Tate and Lyle and Rolls Royce. Though there are others, such as Astra Zeneca that emerged from old stalwarts such as ICI.
The message here is that investments are not static they are constantly evolving and today’s winners will probably not be around in this form in the future.
Markets
There is an old market adage of
“sell in May go away and don’t come back ‘til St Leger Day”.
Clearly this dates from the days of the London season of sporting events, balls and summer holidays.
Whilst this has long gone, the nature of markets does show distinct seasonality, though these days it is more to do with political events and tax.
This is especially so in the USA where capital gains tax calculations take place in May and tax bills have to be funded through share sales.
It is no coincidence that some very high profile divorces are taking place around now!
Also the Biden tax proposals are pointing towards a big increase in the tax charge on US capital gains. The following chart from Morgan Stanley is interesting. Markets are not predictable but sometimes they do rhyme with the past?
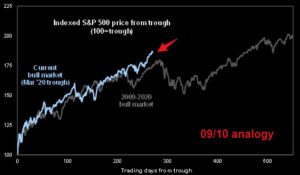
Source: Morgan Stanley
This chart overlays the performance of the S&P 500 since the pandemic-inspired low last March with the 2009 to 2020 bull market. The two trends are remarkably similar.
In May 2010 markets pulled back, but this was healthy and set the basis for a sustained period of share price growth over the following years.
Could this happen again? Well the trading computers will be programmed to look for weakness and the catalyst could be inflation rising ahead of expectations.
Central Banks will be looking not at the headline inflation number but the trend, they will be nervous of moving too late.
A move to an average of say 2.5% will be tolerable, but a sustained move over 3.0% would not. Inflation is the worry, Central Bankers across the world are presently promising to look through the current reopening supply pressures.
However, if they start to think rising prices is becoming embedded, then the money printing presses will have to slow down. But then another great market adage is “bull markets climb walls of fear and worry”.
April 2021
Click Here for Printable Version
This information is not intended to be personal financial advice and is for general information only. Past performance is not a reliable indicator of future results.