
Click Here for Printable Version
2025 was another positive year for balanced portfolios, with the new bull market finally confirmed as growth spread across all equity asset classes. China drove the Far East and Emerging Markets to the top of the performance table followed by Germany and Europe. Here aggressive cuts in interest rates helped the banks whilst huge German financial stimulus helped defence companies. Even the FTSE100 and FT Mid 250 were higher than the USA in the performance table. This was a year when every market that had been left behind in the AI-inspired tech boom of 2024 caught up. As ever in investment “everything eventually reverts to the mean”.
Confidence returned to equity markets as all the big three market drivers turned positive for all geographic areas. Whilst the trend is set by the dominant US markets bargain hunters sought out what were and remain very low historic valuations for this point in the market cycle. Usually, company profits are depressed post a recession, this means that valuations are at their most expensive at the beginning of a bull market cycle, this time, they remain mid-range as company profit growth starts to accelerate.2025 was the first year of tentative profit recovery post the invasion of Ukraine, 2026 should see growth accelerate. This should primarily be from non-tech companies with, as is historically normal, the banks leading the way.
The weakest of the major economies is likely to be the UK. Political decisions to increase taxes will hurt consumer spending and increased government borrowing to spend on areas that won’t contribute to growth is pushing up long term market interest rates. The Bank of England is fighting a rear guard action by cutting short-term interest rates and stopping Quantitative Tightening but the outlook for the UK economy is now entirely dependent on the growth coming from the USA and Europe. If the government overspends again then the UK could face a crisis. A revised EU trade deal might help in the short term.
It is the inflation and interest rate equation that, as ever, drives portfolio returns. They are still on their cyclical journey down this never happens in a straight line. This is the difficult third year of the cycle, have Central Banks done enough or too much? Will inflation reassert itself, will company profits continue their strong recovery, will AI prove itself as the “game changer” that all the commentators are suggesting or is it just a better search engine? 2026 has already started with two big events, Trump has engineered leadership change in Venezuela and more significantly, banned financial institutions from buying homes. Trump with an eye on this year’s mid-term elections seems to be focussing on inflation. In the US rent is a big part of the inflation number, he is in the process of putting his usual wrecking ball through the US housing market to get rent and mortgage rates down. If Trump is indeed serious about reducing US inflation in 2026, we may even see some tariffs being rolled back.
Portfolio Roadmap
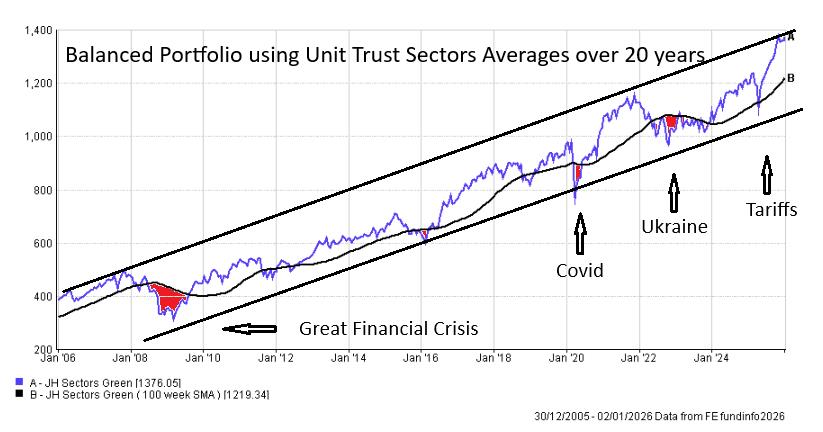
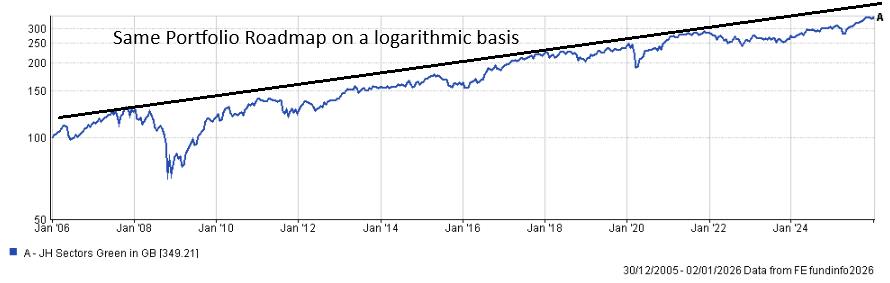
This chart shows a typical balanced portfolio (bonds, equities, and property) built using Investment Association Unit Trust Sector Averages. It is not a client portfolio but reflects general trends and turning points. Once again when the Roadmap touched the bottom end of the tramline it coincided with the US Federal Reserve Bank stating that it had stopped raising interest rates and thus two of the key market drivers, interest rates and inflation, turned positive, therefore so did the Roadmap. The first 20-year chart looks as if the portfolio has reached the top end of the range, however, as the second chart shows, if we change the scale to the correct log basis there is still further to go. Markets are not predictable in the short term, they are full of political and geopolitical noise but in the investment world portfolio performance patterns are repeatable and all they care about are the three big market drivers, interest rates, inflation, and corporate profits.
Interest Rates and Inflation Source: Tradingeconomics.com
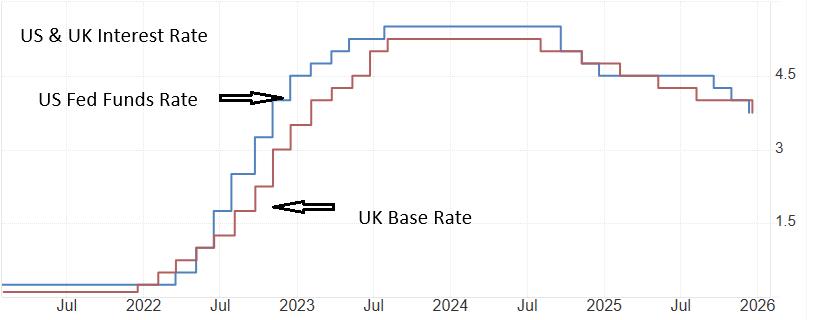
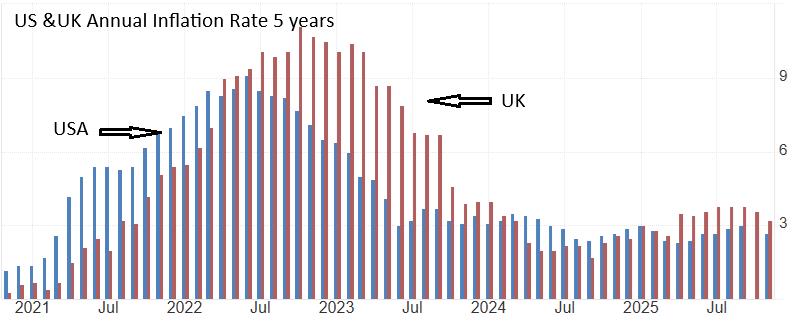
These charts show U.S. and U.K. interest rates and inflation since the invasion of Ukraine and tell the key story of 2026. Inflation has fallen back to “normal” levels, yet interest rates have barely changed. Historically, there is a fixed gap between the level of inflation and the market yield on a government’s debt (e.g., Gilts). Economically, the return from the lowest-risk investment (cash/government bonds) should ideally be just above the rate of inflation. Historically, it has been at a 0.5% premium, it is currently c1.5%. If inflation stabilizes at say 2.5%, then interest rates and bond yields should be around 3.0% to 3.5%. Ten-year gilts are yielding 4.5% (unchanged over 12 months) and remain at least 1.0% too high. Here, the lack of confidence in the fiscal management of the UK Government is an issue. The U.S. 10-year Treasury bond yield has moved down but only fractionally to 4.2%, the Fed has been slow to cut and at 3.75% the Fed Funds rate with the official CPI at 2.7% is at a 1% premium, which represents tight monetary conditions, wrong for this point in the cycle. However, the CPI inflation number is historic, it is not forward looking, Nowflation from the Cleveland Federal Reserve has the current US inflation rate at 1.58% whilst another measure Truflation has it at 1.91%, either way the US Fed Funds rate is too high and thus the direction of both interest rates and inflation remains down and thus positive for markets
Earnings Growth
Ultimately for a portfolio to grow in value it requires global economies to grow and for companies to make bigger profits. These profits are then partly distributed to investors as dividends or share buybacks and the rest retained to increase a company’s balance sheet and thus it’s intrinsic value. If company profits go up, then so must share prices and vice versa. Corporate profits do go down significantly during recessions. Whilst the global economy as whole avoided a formal recession in 2023 some economies didn’t, however, crucially corporate earnings did fall just as in a recession, especially for non-tech companies. Indeed, ex-IT and Oil US corporate profits were down 17%. During 2024, as this first chart below from Goldman Sachs shows, Earnings Per Share (including IT and Oil) recovered strongly and this continued in 2025. But this masks the true picture in 2024 all the growth came from the big tech companies, in 2025 the rest started to catch up.
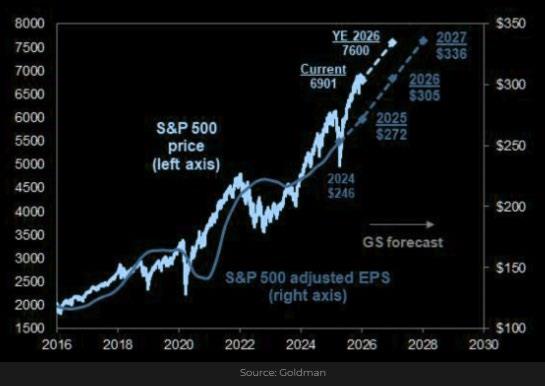
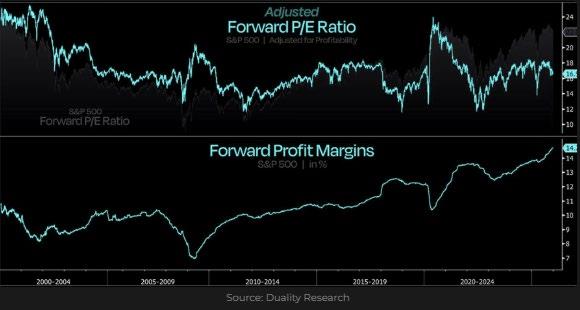
Earnings growth on its own is meaningless, it needs to be compared to valuations. This second chart shows that current forward valuation for the S&P 500 is 16.5 which is in the middle of the historic range. If growth is better than expected, then reasonably valued US shares become cheap. That could easily happen if interest rates come down more than markets are currently pricing in.
UK Equities
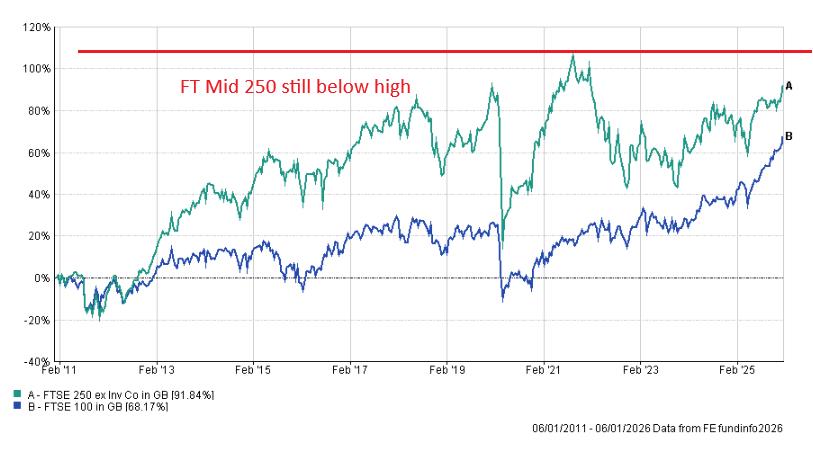
UK shares remain “off the scale” in terms of undervaluation. The problem remains a lack of confidence in the UK Government where tax rises have hit consumer and business confidence. Nevertheless, for most UK companies their profits are not reliant on the UK consumer. Historically, a lack of technology companies has held the FTSE100 back, it is however home to the world’s largest mining companies, at this point in the cycle commodities should and are starting to boom, hence the recent rally. Historically the fastest growing and highest returning part of the UK market is the FT Mid 250. Here valuations remain low with forecasts suggesting above average levels of earnings growth this year. It remains below its pre-Ukraine High.
European Equities
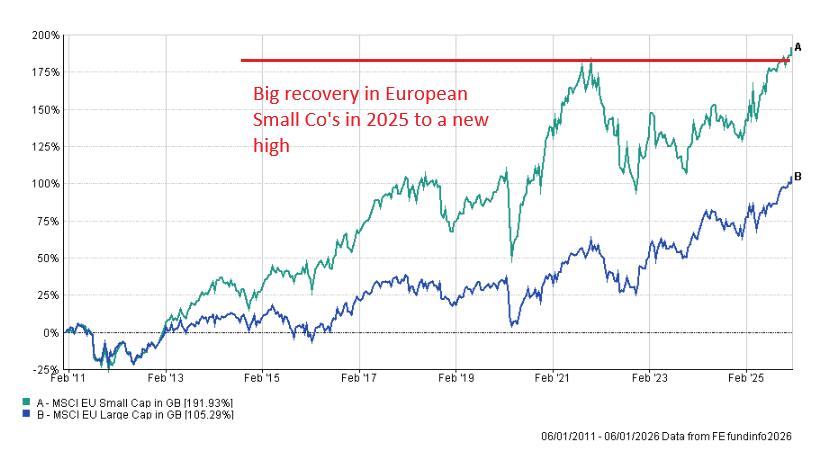
European moved to the top of the performance tables this year. The ECB was able to cut interest rates and did so aggressively to 2.15%, way below the UK and USA. At the same time German stimulus is of a huge scale and will feed directly into corporate profits. Defence manufacturers led the way, but crucially European banks are finally recovering over 17 years after the “Great Financial Crisis”. Spain and Italy, long term drags on the EU economy, are now leading with France the economic dead weight. Unlike in the UK and USA smaller companies topped the performance table, showing what lower interest rates can do and indicate what might be to come in the US and UK?
US Equities
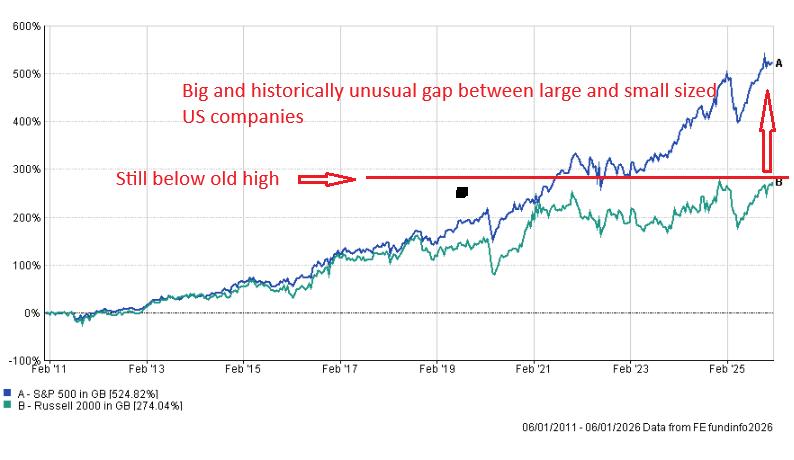
US and Global equity indices are dominated by Alphabet, Amazon, Apple, Meta, Microsoft, Nvidia and Tesla. They are fast growing, investing heavily in Artificial Intelligence and expensive. Everything else in the US market is only now starting to see growth and remain fundamentally cheap. Trump is the wildcard that is holding back the US economy. Tariffs and high interest rates are leading to sluggish consumer demand and job layoffs. But there is a mid-term election coming. The incumbent party rarely does well, but there are signs that Trump will do whatever it takes to get the US booming. A new Fed Chair is imminent, measures to curb inflation are underway and $2,000 cheques in the post have been promised. Money is already moving from tech to “the rest.” AI is waiting for the first “killer” app of the technology.
Emerging Markets and China/Hong Kong
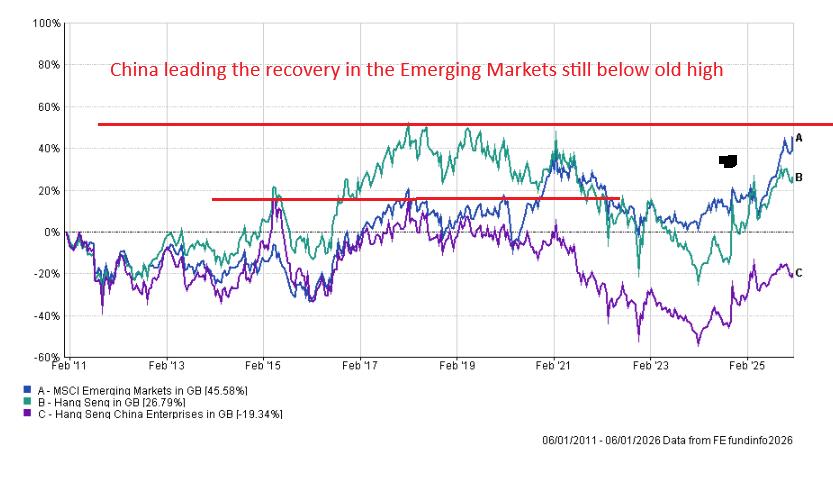
China was supposed to a big loser form the Trump tariffs and India a big winner. Turned out the opposite was true. China had leverage in rare earths and magnets and can develop AI software that is just as good as the USA and is offering it for free. China is going “all in on AI” whilst its exports of manufactured goods continue to grow despite the tariffs. India meanwhile is caught in the “dance” between Putin and Trump and is the last to get a trade deal, which should be resolved early in 2026. A weak dollar is historically good for Far Eastern and Emerging market equities and bonds. In theory the dollar should continue to be weak this year.
Investment Markets in 2026
Investment markets are not predictable, they do however, tend to follow repeatable patterns. After a classic drawdown period when inflation moved higher post the Russian invasion of Ukraine, they have now entered the growth phase of the cycle. Typically, this should last around five to seven years, 2026 is year three. But as the adage states, “Bull markets climb walls of fear and worry.” The most difficult phase of the cycle is the one we are currently in. Central Banks should be passing the baton to earnings growth this year, the ECB is already there, the Fed and the Bank of England are lagging. The inflation numbers are forecast to drop below 2% for both economies. This should allow interest rates to fall to c3%. The big question is can they bring long dated bond yields down? If not, then mortgage rates in both economies are unlikely to move lower and thus act as a major drag. The AI bubble has not popped; traders are watching for the next stage of its development. So far it has all been about building the data processing capacity in anticipation of huge demand. The worry is that there won’t be the demand, that is probably pessimistic, particularly as the companies building the capacity will also be writing the software! Who knows when we get to these new programmes, probably not just yet. 2026 should be the year when true economic and profit growth finally comes through. Trump needs it to and that is no bad thing.